News CNCnetPDM About us Support  
       

OUTPUT QUANTITY | INTERNET OF THINGS

TOP

For any kind of measurement it’s imperative for manufacturers to know the amount of parts produced by the equipment. Now that the customer knew about the state of the production resources at a given point in time this requirement waited for a solution.

Goal:

  • Acquire equipment output from highly diverse manufacturing resources

To be able to collect output the project team first had to look at the manufacturing techniques used by different types of machines. In general it was possible to distinguish between several methods:

Manufacturing Techniques

  • One part - multiple work steps: Here the machine subsequently performs and completes all steps of an operation for a single work piece. This may include changing tools within the operation. As soon as the cycle has finished one part is output.
  • One tool - multiple parts: Here the machine operates on multiple work pieces at the same time and performs a part of the operation with a specific tool on all mounted pieces. After changing the tool the device repeats the procedure. As soon as all steps of the operation have been executed on all parts a specified number of parts has been output.
  • One work step - multiple parts: The manufacturing device performs a single task on multiple work pieces at the same time. As soon as the operation is finished a defined number of parts is output.

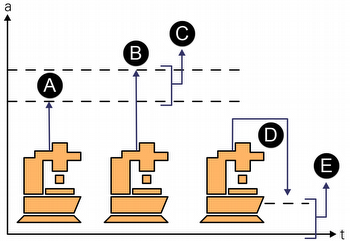
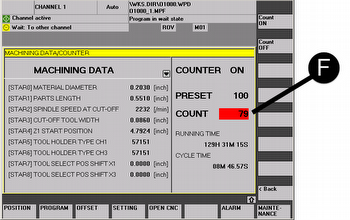
As the project team knew that the majority of PLC and CNC controlled machines has an internal part counter (F) which stores the total number of cycles executed by the device it should be possible to read and use this value in the same way as with machine-states. The querying service then simply would have to subtract the value received in the last reading cycle (A) from the actual one (B) and report the difference (C). In case of a ‘one tool - multiple parts’ or ‘one work step - multiple parts’ manufacturing technique the result would have to be multiplied by the number of parts mounted at the clamping device.

Acquisition of part counter values

FIG 1:    Acquisition of part counter values (click to enlarge)

Screenshot of a machine’s operator panel showing part counter values

FIG 2:    Screenshot of a machine’s operator panel showing part counter values (click to enlarge)

Unfortunately in reality it isn’t that simple... Although the part counter values are increased and stored with every cycle completed it is possible to reset them to zero, either by pushing a reset button or clearing out the value at the operator panel. In case the data acquisition solution now would calculate the difference between the last read (B) and the current value (D) the result would be negative. This simply isn’t correct and would lead to unpredictable results.

  • To resolve this potential issue the data acquisition service was equipped with additional logic that is able to detect reset operations (previously read value is higher than actual value) and calculate the increment of the output (E) correctly by taking the reset into account.

Although PC controlled devices such as Laser Markers and Molding machines usually do not have this built in part counter it was possible to again use CNCnetPDM’s log file analyzing functionality to accomplish this task. As for the other machine types the data acquisition service internally maintains an own part counter for every machine. In addition to finding out the ‘mutually exclusive machine state’ the service was equipped with logic that searches the log file for entries that indicate part output since the last reading cycle. If more than one entry is found the service sums up the number of parts produced before sending the value to the machine’s part counter at the server. Fortunately no reset detection functionality was needed for this type of machines.

Functions:

  • Acquisition of part counter values from CNC, PLC and PC controlled devices
  • Detection and compensation of reset procedures

Benefits:

  • Enabled comparable counting of equipment output from machines that perform different manufacturing techniques
  • Eliminated the need for manual input of the number of parts produced
  • Took into account reset procedures


Privacy notice

This website uses cookies. By continuing to use it you agree to our privacy policy. 

https://www.inventcom.net/success-stories/internet-of-things/output-quantity

Success Stories | Internet of Things | Overview

The Internet of Things (IoT) becomes reality for one of the top 500 fastest growing manufacturing companies in the US.... [read more]
Success Stories | Internet of Things | Overview

Success Stories | Internet of Things | Machine States

The initial requirement of the customer sounded pretty simple: ‘We’d just like to know whether our manufacturing equipment is producing or not’. When standing... [read more]
Success Stories | Internet of Things | Machine States

Success Stories | Internet of Things | Operational Data

Of course automatic reporting of machine-states and part counter values by the manufacturing devices was great progress but the customer now needed to see this data in context... [read more]
Success Stories | Internet of Things | Operational Data

Success Stories | Internet of Things | Quality Data

To be able to create reports about the produced quality additional data from the shop floor was needed. Although it would have been perfect to get this data directly from the... [read more]
Success Stories | Internet of Things | Quality Data

Success Stories | Internet of Things | Scheduling

To perform any target to actual comparison and output Key-Performance-Indicators (KPI) such as Overall Equipment Effectivity (OEE) it was necessary to integrate scheduling data... [read more]
Success Stories | Internet of Things | Scheduling

Success Stories | Internet of Things | Data Processing

Even having all required information in a single data repository again was good progress the next challenges were to put all data into relationship, build the desired reports and... [read more]
Success Stories | Internet of Things | Data Processing

Success Stories | Internet of Things | Dashboards Overview

The customer's solution Oracle’s Manufacturing Operations Center (MOC) uses the concept of providing web- and role-based dashboards for different employees to gain the... [read more]
Success Stories | Internet of Things | Dashboards Overview

Success Stories | Internet of Things | Production Supervisor

This dashboard acts like an electronic whiteboard that automatically fetches data from the customers shop floor devices and provides real-time information about equipment status... [read more]
Success Stories | Internet of Things | Production Supervisor

Success Stories | Internet of Things | Overall Equipment Effectiveness OEE

The standard of Oracle’s Manufacturing Operations Center (MOC) ships with a dashboard called ‘Plant Manager’ which includes several reports that output Overall... [read more]
Success Stories | Internet of Things | Overall Equipment Effectiveness OEE

Success Stories | Internet of Things | Production Loss Analysis

This dashboard outputs information about production loss distribution (B), effective production capacity (C) and production loss (D) for machines in a department of a plant... [read more]
Success Stories | Internet of Things | Production Loss Analysis

Success Stories | Internet of Things | Equipment Downtime Analysis

This dashboard shows downtime reasons machines in one or all departments of a plant within a selected period (A). The pie chart (B) below the selection area outputs the... [read more]
Success Stories | Internet of Things | Equipment Downtime Analysis

Success Stories | Internet of Things | Production Slippage Trend

This dashboard, accessible from the equipment downtime analysis report outputs, in addition to total production value (A), production slippage hours (B) and a performance to... [read more]
Success Stories | Internet of Things | Production Slippage Trend

Success Stories | Internet of Things | Equipment Idle Time Reasons

By using this dashboard the reasons for idle times of machines within a selected period (A) can be analyzed. Right to the pie chart (B) with percentage distribution of... [read more]
Success Stories | Internet of Things | Equipment Idle Time Reasons

Success Stories | Internet of Things | Equipment Efficiency Analysis

For selected equipment in one or all departments of a plant (A) this dashboard outputs an analysis about the efficiency of the manufacturing resources within a period of time. In... [read more]
Success Stories | Internet of Things | Equipment Efficiency Analysis

Success Stories | Internet of Things | Equipment Scrap Analysis

This dashboard shows an analysis about bad quality produced by manufacturing equipment in one or all departments of a plant (A) within a selected period. Right to a pie chart (B)... [read more]
Success Stories | Internet of Things | Equipment Scrap Analysis

Success Stories | Internet of Things | Batch Performance

This dashboard provides analytics tools for work orders executed within a selected period in all or single plants and product categories (A). The graph (B) on the left side below... [read more]
Success Stories | Internet of Things | Batch Performance

Success Stories | Internet of Things | Production Performance

This dashboard enables comparison of scheduled with actual equipment usage. Output can be limited to one or all departments in a plant within a selected period (A). The... [read more]
Success Stories | Internet of Things | Production Performance
Modified: 2023-12-01