News CNCnetPDM About us Support  
       

EQUIPMENT EFFICIENCY ANALYSIS | INTERNET OF THINGS

TOP

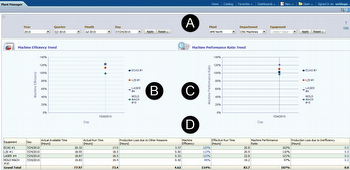
For selected equipment in one or all departments of a plant (A) this dashboard outputs an analysis about the efficiency of the manufacturing resources within a period of time.

In addition to graphical output of the machine efficiency (B) and performance (C) trend the report shows a table (D) with information about actual available time, actual run time, production loss due to other reasons, machine efficiency, effective run time, machine performance ratio and production loss due to inefficiency for all selected machines.

Equipment Efficiency Analysis

FIG 1:    Plant Manager Dashboard - Equipment Efficiency Analysis (click to enlarge)

Privacy notice

This website uses cookies. By continuing to use it you agree to our privacy policy. 

https://www.inventcom.net/success-stories/internet-of-things/equipment-efficiency-analysis

Success Stories | Internet of Things | Overview

The Internet of Things (IoT) becomes reality for one of the top 500 fastest growing manufacturing companies in the US.... [read more]
Success Stories | Internet of Things | Overview

Success Stories | Internet of Things | Machine States

The initial requirement of the customer sounded pretty simple: ‘We’d just like to know whether our manufacturing equipment is producing or not’. When standing... [read more]
Success Stories | Internet of Things | Machine States

Success Stories | Internet of Things | Output Quantity

For any kind of measurement it’s imperative for manufacturers to know the amount of parts produced by the equipment. Now that the customer knew about the state of the... [read more]
Success Stories | Internet of Things | Output Quantity

Success Stories | Internet of Things | Operational Data

Of course automatic reporting of machine-states and part counter values by the manufacturing devices was great progress but the customer now needed to see this data in context... [read more]
Success Stories | Internet of Things | Operational Data

Success Stories | Internet of Things | Quality Data

To be able to create reports about the produced quality additional data from the shop floor was needed. Although it would have been perfect to get this data directly from the... [read more]
Success Stories | Internet of Things | Quality Data

Success Stories | Internet of Things | Scheduling

To perform any target to actual comparison and output Key-Performance-Indicators (KPI) such as Overall Equipment Effectivity (OEE) it was necessary to integrate scheduling data... [read more]
Success Stories | Internet of Things | Scheduling

Success Stories | Internet of Things | Data Processing

Even having all required information in a single data repository again was good progress the next challenges were to put all data into relationship, build the desired reports and... [read more]
Success Stories | Internet of Things | Data Processing

Success Stories | Internet of Things | Dashboards Overview

The customer's solution Oracle’s Manufacturing Operations Center (MOC) uses the concept of providing web- and role-based dashboards for different employees to gain the... [read more]
Success Stories | Internet of Things | Dashboards Overview

Success Stories | Internet of Things | Production Supervisor

This dashboard acts like an electronic whiteboard that automatically fetches data from the customers shop floor devices and provides real-time information about equipment status... [read more]
Success Stories | Internet of Things | Production Supervisor

Success Stories | Internet of Things | Overall Equipment Effectiveness OEE

The standard of Oracle’s Manufacturing Operations Center (MOC) ships with a dashboard called ‘Plant Manager’ which includes several reports that output Overall... [read more]
Success Stories | Internet of Things | Overall Equipment Effectiveness OEE

Success Stories | Internet of Things | Production Loss Analysis

This dashboard outputs information about production loss distribution (B), effective production capacity (C) and production loss (D) for machines in a department of a plant... [read more]
Success Stories | Internet of Things | Production Loss Analysis

Success Stories | Internet of Things | Equipment Downtime Analysis

This dashboard shows downtime reasons machines in one or all departments of a plant within a selected period (A). The pie chart (B) below the selection area outputs the... [read more]
Success Stories | Internet of Things | Equipment Downtime Analysis

Success Stories | Internet of Things | Production Slippage Trend

This dashboard, accessible from the equipment downtime analysis report outputs, in addition to total production value (A), production slippage hours (B) and a performance to... [read more]
Success Stories | Internet of Things | Production Slippage Trend

Success Stories | Internet of Things | Equipment Idle Time Reasons

By using this dashboard the reasons for idle times of machines within a selected period (A) can be analyzed. Right to the pie chart (B) with percentage distribution of... [read more]
Success Stories | Internet of Things | Equipment Idle Time Reasons

Success Stories | Internet of Things | Equipment Scrap Analysis

This dashboard shows an analysis about bad quality produced by manufacturing equipment in one or all departments of a plant (A) within a selected period. Right to a pie chart (B)... [read more]
Success Stories | Internet of Things | Equipment Scrap Analysis

Success Stories | Internet of Things | Batch Performance

This dashboard provides analytics tools for work orders executed within a selected period in all or single plants and product categories (A). The graph (B) on the left side below... [read more]
Success Stories | Internet of Things | Batch Performance

Success Stories | Internet of Things | Production Performance

This dashboard enables comparison of scheduled with actual equipment usage. Output can be limited to one or all departments in a plant within a selected period (A). The... [read more]
Success Stories | Internet of Things | Production Performance
Modified: 2015-11-13