News CNCnetPDM About us Support  
       

OPERATIONAL DATA | INTERNET OF THINGS

TOP

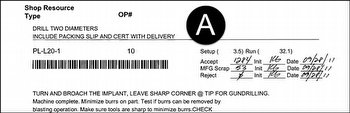
Of course automatic reporting of machine-states and part counter values by the manufacturing devices was great progress but the customer now needed to see this data in context with work-orders, operations and part numbers to be able to create meaningful reports. Because this information is written on a document called ‘work-order traveler’ (A) accompanying the workpiece and not known by the machine ways had to be found to join these things together.

Goal:

  • Contextualize work-order related information with machine states and output

Part of a work order traveler with barcode containing work order number and operation

FIG 1:    Part of a work order traveler with barcode containing work order number and operation (click to enlarge)

One possible option would have been to ‘inform’ the machine about the work order it currently performs and then read it just like machine states and part counter values. For PLC, CNC and PC controlled machines this can be done by transmission of these numbers to the controller via OPC or CNCnetPDM and storing them as variables that can be read afterwards.

For CNC and PC controlled machines it is also possible to insert these values as variables into the NC program and read them when the program is executed.

There are pros and cons for both techniques. In case the values are stored at the controller as variables major benefits would be that no additional hardware like barcode readers or PC’s is needed at the shop floor and no additional tasks have to be performed by the machine operators. However, someone has to perform this task when the work order starts and clear out the variables as soon as the work order ends. If this doesn’t happen states and part counts are either assigned to the wrong (previous or next) work order or the work order continues to run even it is already finished.

In case the NC program variant is used it would also be advantageous that neither additional hardware at the shop floor nor actions performed by the employees are required. However, it has to be taken into account that NC programs typically are part-, not work-order-specific. This would require one NC program for every work order even if its content stays the same. In addition, the fact that most operators leave the machine switched on with the last NC program loaded at the controller even when the work order is finished is more an argument against using this method.

To finally accomplish this task another route was taken. The customer’s program for operational data acquisition (ODA) that runs on PC’s at the shop floor could be used. Whenever a work order is started the operator selects the machine in the ODA program and scans the barcodes which contain work order number, operation and part number from the work order traveler. To finish or interrupt the work order the employee again selects the machine and chooses the appropriate action. The ODA program stores the data in a SQL database at the data acquisition server.

For contextualization of machine with operational data CNCnetPDM as well as the customer’s Data Service program have the ability to, whenever data is queried from the machines, automatically lookup the current work order, operation and part number for a machine in the ODA program’s database and add it to the data received from the device. This turned out to be the most effective and less error prone method.

Functions:

  • Addition of work-order, part-number and operation to machine data

Benefits:

  • Enabled contextualization of work-order related data with machine data
  • Eliminated the need for external devices for operational data acquisition at the machines
  • Reduced implementation costs by utilizing the customers solution for operational data acquisition

Privacy notice

This website uses cookies. By continuing to use it you agree to our privacy policy. 

https://www.inventcom.net/success-stories/internet-of-things/operational-data

Success Stories | Internet of Things | Overview

The Internet of Things (IoT) becomes reality for one of the top 500 fastest growing manufacturing companies in the US.... [read more]
Success Stories | Internet of Things | Overview

Success Stories | Internet of Things | Machine States

The initial requirement of the customer sounded pretty simple: ‘We’d just like to know whether our manufacturing equipment is producing or not’. When standing... [read more]
Success Stories | Internet of Things | Machine States

Success Stories | Internet of Things | Output Quantity

For any kind of measurement it’s imperative for manufacturers to know the amount of parts produced by the equipment. Now that the customer knew about the state of the... [read more]
Success Stories | Internet of Things | Output Quantity

Success Stories | Internet of Things | Quality Data

To be able to create reports about the produced quality additional data from the shop floor was needed. Although it would have been perfect to get this data directly from the... [read more]
Success Stories | Internet of Things | Quality Data

Success Stories | Internet of Things | Scheduling

To perform any target to actual comparison and output Key-Performance-Indicators (KPI) such as Overall Equipment Effectivity (OEE) it was necessary to integrate scheduling data... [read more]
Success Stories | Internet of Things | Scheduling

Success Stories | Internet of Things | Data Processing

Even having all required information in a single data repository again was good progress the next challenges were to put all data into relationship, build the desired reports and... [read more]
Success Stories | Internet of Things | Data Processing

Success Stories | Internet of Things | Dashboards Overview

The customer's solution Oracle’s Manufacturing Operations Center (MOC) uses the concept of providing web- and role-based dashboards for different employees to gain the... [read more]
Success Stories | Internet of Things | Dashboards Overview

Success Stories | Internet of Things | Production Supervisor

This dashboard acts like an electronic whiteboard that automatically fetches data from the customers shop floor devices and provides real-time information about equipment status... [read more]
Success Stories | Internet of Things | Production Supervisor

Success Stories | Internet of Things | Overall Equipment Effectiveness OEE

The standard of Oracle’s Manufacturing Operations Center (MOC) ships with a dashboard called ‘Plant Manager’ which includes several reports that output Overall... [read more]
Success Stories | Internet of Things | Overall Equipment Effectiveness OEE

Success Stories | Internet of Things | Production Loss Analysis

This dashboard outputs information about production loss distribution (B), effective production capacity (C) and production loss (D) for machines in a department of a plant... [read more]
Success Stories | Internet of Things | Production Loss Analysis

Success Stories | Internet of Things | Equipment Downtime Analysis

This dashboard shows downtime reasons machines in one or all departments of a plant within a selected period (A). The pie chart (B) below the selection area outputs the... [read more]
Success Stories | Internet of Things | Equipment Downtime Analysis

Success Stories | Internet of Things | Production Slippage Trend

This dashboard, accessible from the equipment downtime analysis report outputs, in addition to total production value (A), production slippage hours (B) and a performance to... [read more]
Success Stories | Internet of Things | Production Slippage Trend

Success Stories | Internet of Things | Equipment Idle Time Reasons

By using this dashboard the reasons for idle times of machines within a selected period (A) can be analyzed. Right to the pie chart (B) with percentage distribution of... [read more]
Success Stories | Internet of Things | Equipment Idle Time Reasons

Success Stories | Internet of Things | Equipment Efficiency Analysis

For selected equipment in one or all departments of a plant (A) this dashboard outputs an analysis about the efficiency of the manufacturing resources within a period of time. In... [read more]
Success Stories | Internet of Things | Equipment Efficiency Analysis

Success Stories | Internet of Things | Equipment Scrap Analysis

This dashboard shows an analysis about bad quality produced by manufacturing equipment in one or all departments of a plant (A) within a selected period. Right to a pie chart (B)... [read more]
Success Stories | Internet of Things | Equipment Scrap Analysis

Success Stories | Internet of Things | Batch Performance

This dashboard provides analytics tools for work orders executed within a selected period in all or single plants and product categories (A). The graph (B) on the left side below... [read more]
Success Stories | Internet of Things | Batch Performance

Success Stories | Internet of Things | Production Performance

This dashboard enables comparison of scheduled with actual equipment usage. Output can be limited to one or all departments in a plant within a selected period (A). The... [read more]
Success Stories | Internet of Things | Production Performance
Modified: 2015-11-22