News CNCnetPDM About us Support  


OVERALL EQUIPMENT EFFECTIVENESS OEE | DASHBOARDS

TOP

The standard of Oracle’s Manufacturing Operations Center (MOC) ships with a dashboard called ‘Plant Manager’ which includes several reports that output Overall Equipment Effectiveness (OEE) Key Performance Indicators (KPIs) for various levels of the enterprise such as plant, department, resource or equipment.

Dashboards Overview

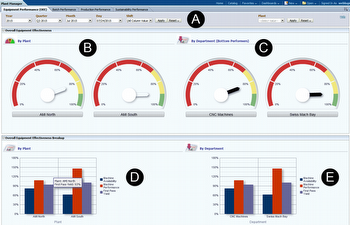
When the plant manager dashboard initially is opened it shows ‘the big picture’, OEE values for one or more plants. In the first area on top (A) a period of time for which OEE should be output as well as shifts and plants can be selected. Below, on the left side, the measured OEE data for the plants (B) is shown. Left to it OEE values for departments (C) with the lowest performance are output. The lower area contains graphs that show machine availability, machine performance and first pass yield again for plants and departments.

Plant Manager Dashboard - OEE by plant

FIG 1:    Plant Manager Dashboard - OEE by plant (click to enlarge)

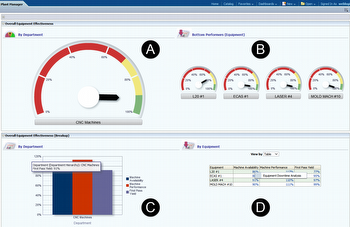
A click on one of the departments leads to a more detailed report that outputs OEE data for the selected department (A) including its machines (B). In the area below machine availability, machine performance and first pass yield (C) for the department is shown. On the right side the dashboard outputs these values for the machines (D)

Plant Manager Dashboard - OEE by department

FIG 2:    Plant Manager Dashboard - OEE by department (click to enlarge)

Clicking on one of the results for the machines leads to a more detailed report for the selected item, machine availability opens equipment downtime analysis, machine performance opens equipment efficiency analysis and first pass yield opens equipment scarp analysis.

Privacy notice

This website uses cookies. By continuing to use it you agree to our privacy policy. 

https://www.inventcom.net/oracle-manufacturing-operations-center/dashboards/overall-equipment-effectiveness-oee

Oracle Manufacturing Operations Center | Dashboards | Overview

Oracle’s Manufacturing Operations Center (MOC) uses the concept of providing web- and role-based dashboards for different employees to gain the insights they need too. The... [read more]
Oracle Manufacturing Operations Center | Dashboards | Overview

Oracle Manufacturing Operations Center | Dashboards | Production Supervisor

This dashboard acts like an electronic whiteboard that automatically fetches data from your shop floor devices and provides real-time information about equipment status and... [read more]
Oracle Manufacturing Operations Center | Dashboards | Production Supervisor

Oracle Manufacturing Operations Center | Dashboards | Production Loss Analysis

This dashboard outputs information about production loss distribution (B), effective production capacity (C) and production loss (D) for machines in a department of a plant... [read more]
Oracle Manufacturing Operations Center | Dashboards | Production Loss Analysis

Oracle Manufacturing Operations Center | Dashboards | Equipment Downtime Analysis

This dashboard shows downtime reasons machines in one or all departments of a plant within a selected period (A). The pie chart (B) below the selection area outputs the... [read more]
Oracle Manufacturing Operations Center | Dashboards | Equipment Downtime Analysis

Oracle Manufacturing Operations Center | Dashboards | Production Slippage Trend

This dashboard, accessible from the equipment downtime analysis report outputs, in addition to total production value (A), production slippage hours (B) and a performance to... [read more]
Oracle Manufacturing Operations Center | Dashboards | Production Slippage Trend

Oracle Manufacturing Operations Center | Dashboards | Equipment Idle Time Reasons

By using this dashboard the reasons for idle times of machines within a selected period (A) can be analyzed. Right to the pie chart (B) with percentage distribution of... [read more]
Oracle Manufacturing Operations Center | Dashboards | Equipment Idle Time Reasons

Oracle Manufacturing Operations Center | Dashboards | Equipment Efficiency Analysis

For selected equipment in one or all departments of a plant (A) this dashboard outputs an analysis about the efficiency of the manufacturing resources within a period of time. In... [read more]
Oracle Manufacturing Operations Center | Dashboards | Equipment Efficiency Analysis

Oracle Manufacturing Operations Center | Dashboards | Equipment Scrap Analysis

This dashboard shows an analysis about bad quality produced by manufacturing equipment in one or all departments of a plant (A) within a selected period. Right to a pie chart (B)... [read more]
Oracle Manufacturing Operations Center | Dashboards | Equipment Scrap Analysis

Oracle Manufacturing Operations Center | Dashboards | Batch Performance

This dashboard provides analytics tools for work orders executed within a selected period in all or single plants and product categories (A). The graph (B) on the left side below... [read more]
Oracle Manufacturing Operations Center | Dashboards | Batch Performance

Oracle Manufacturing Operations Center | Dashboards | Production Performance

This dashboard enables comparison of scheduled with actual equipment usage. Output can be limited to one or all departments in a plant within a selected period (A). The... [read more]
Oracle Manufacturing Operations Center | Dashboards | Production Performance
Modified: 2016-09-20