News CNCnetPDM About us Support  


EQUIPMENT DOWNTIME ANALYSIS | DASHBOARDS

TOP

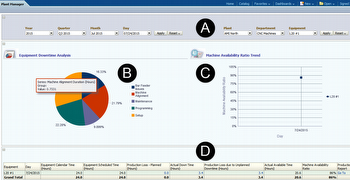
This dashboard shows downtime reasons machines in one or all departments of a plant within a selected period (A). The pie chart (B) below the selection area outputs the percentage distribution of downtime reasons. Moving the mouse over one of the items opens a small window with the amount of hours. In the graph on the right side (C) the machine availability ratio trend on a percentage basis is shown.

The table (D) below contains the following details for the selected equipment in hours per day: equipment calendar time, equipment scheduled time, production loss - planned hours, actual down time, production loss due to unplanned downtime, actual available time, machine availability ratio in percentage terms and a link that leads to the dashboard production slippage trend.

Equipment Downtime Analysis

FIG 1:    Plant Manager Dashboard - Equipment Downtime Analysis (click to enlarge)

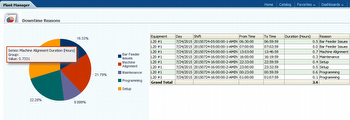
Clicking on one of the items in table (D) opens the downtime-reasons dashboard (E) which outputs a detailed list of downtimes with start and end time, duration and reason for the selected machine and period.

Equipment Downtime Reasons Report

FIG 2:    Plant Manager Dashboard - Equipment Downtime Reasons Report (click to enlarge)

Privacy notice

This website uses cookies. By continuing to use it you agree to our privacy policy. 

https://www.inventcom.net/oracle-manufacturing-operations-center/dashboards/equipment-downtime-analysis

Oracle Manufacturing Operations Center | Dashboards | Overview

Oracle’s Manufacturing Operations Center (MOC) uses the concept of providing web- and role-based dashboards for different employees to gain the insights they need too. The... [read more]
Oracle Manufacturing Operations Center | Dashboards | Overview

Oracle Manufacturing Operations Center | Dashboards | Production Supervisor

This dashboard acts like an electronic whiteboard that automatically fetches data from your shop floor devices and provides real-time information about equipment status and... [read more]
Oracle Manufacturing Operations Center | Dashboards | Production Supervisor

Oracle Manufacturing Operations Center | Dashboards | Overall Equipment Effectiveness OEE

The standard of Oracle’s Manufacturing Operations Center (MOC) ships with a dashboard called ‘Plant Manager’ which includes several reports that output Overall... [read more]
Oracle Manufacturing Operations Center | Dashboards | Overall Equipment Effectiveness OEE

Oracle Manufacturing Operations Center | Dashboards | Production Loss Analysis

This dashboard outputs information about production loss distribution (B), effective production capacity (C) and production loss (D) for machines in a department of a plant... [read more]
Oracle Manufacturing Operations Center | Dashboards | Production Loss Analysis

Oracle Manufacturing Operations Center | Dashboards | Production Slippage Trend

This dashboard, accessible from the equipment downtime analysis report outputs, in addition to total production value (A), production slippage hours (B) and a performance to... [read more]
Oracle Manufacturing Operations Center | Dashboards | Production Slippage Trend

Oracle Manufacturing Operations Center | Dashboards | Equipment Idle Time Reasons

By using this dashboard the reasons for idle times of machines within a selected period (A) can be analyzed. Right to the pie chart (B) with percentage distribution of... [read more]
Oracle Manufacturing Operations Center | Dashboards | Equipment Idle Time Reasons

Oracle Manufacturing Operations Center | Dashboards | Equipment Efficiency Analysis

For selected equipment in one or all departments of a plant (A) this dashboard outputs an analysis about the efficiency of the manufacturing resources within a period of time. In... [read more]
Oracle Manufacturing Operations Center | Dashboards | Equipment Efficiency Analysis

Oracle Manufacturing Operations Center | Dashboards | Equipment Scrap Analysis

This dashboard shows an analysis about bad quality produced by manufacturing equipment in one or all departments of a plant (A) within a selected period. Right to a pie chart (B)... [read more]
Oracle Manufacturing Operations Center | Dashboards | Equipment Scrap Analysis

Oracle Manufacturing Operations Center | Dashboards | Batch Performance

This dashboard provides analytics tools for work orders executed within a selected period in all or single plants and product categories (A). The graph (B) on the left side below... [read more]
Oracle Manufacturing Operations Center | Dashboards | Batch Performance

Oracle Manufacturing Operations Center | Dashboards | Production Performance

This dashboard enables comparison of scheduled with actual equipment usage. Output can be limited to one or all departments in a plant within a selected period (A). The... [read more]
Oracle Manufacturing Operations Center | Dashboards | Production Performance
Modified: 2016-09-20