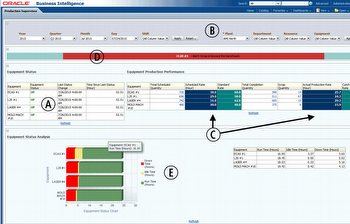
This dashboard acts like an electronic whiteboard that automatically fetches data from your shop floor devices and provides real-time information about equipment status and production performance.
FIG.1: Production Supervisor Dashboard (click to enlarge, use scrollbar to see all details)
Using this dashboard you get information about:
Actual state of production equipment (A) in selected plants, departments and/or resource groups (B)
Scheduled and actual hourly production rate (C)
In case there is a delay between scheduled and actual production rate the dashboard outputs a visible alert for the equipment (D)
In addition this report shows an analysis of the equipment status (Run, Idle and Down Time) (E) for selected machines and periods of time. Initially data of the current day is shown
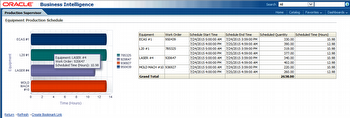
Scheduled work-orders and quantities for selected periods of time
FIG.2: Scheduled work-orders and quantities (click to enlarge)
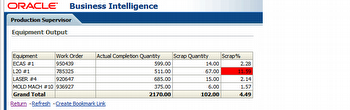
Actual work-order, completion and scrap quantity
FIG.3: Actual work-order, completion and scrap quantity (click to enlarge)
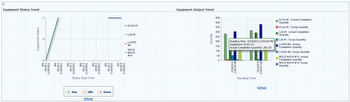
At the bottom of the dashboard status and output trend of the selected equipment is shown.
FIG.4: Equipment status and output trend (click to enlarge)
Without programming skills required the Production Supervisor Dashboard can easily be customized to, for example:
Add additional colums like summary, average, minimum or maximum values for selected items