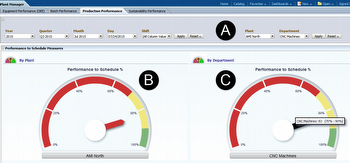
This dashboard enables comparison of scheduled with actual equipment usage. Output can be limited to one or all departments in a plant within a selected period (A). The speedometer graph (B) on the left side shows the results for the plant whereas the one on the right side contains values for the department.
FIG 1: Plant Manager Dashboard - Production Performance Report - Speedometers (click to enlarge)
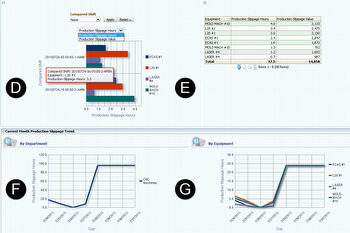
The bar chart (D) below the speedometers shows production slippage hours or production slippage values caused by downtimes for every machine in the selection. Production slippage value is calculated by combining the machine’s hourly rate with item costs. The cost values can be adjusted for every machine and item. By using the dropdown field under ‘compared shift’ results for the current selection can be compared with shifts in other periods. Right to it a list (E) with production slippage hours and values for the equipment is output. The area below contains diagrams that show the production slippage trend for the current month for the department (F) and the manufacturing devices (G).
FIG 2: Plant Manager Dashboard - Production Performance Report - Production Slippage (click to enlarge)