News CNCnetPDM About us Support  


EQUIPMENT IDLE TIME REASONS | DASHBOARDS

TOP

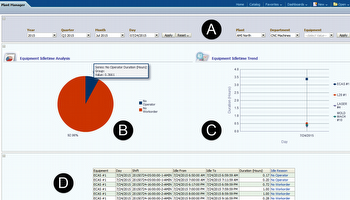
By using this dashboard the reasons for idle times of machines within a selected period (A) can be analyzed. Right to the pie chart (B) with percentage distribution of non-machine specific downtimes such as ‘no work order’ or ‘no operator’ a graph (C) with information about the trend of these states is shown. The table (D) at the bottom shows a list with start and end time as well as the reason for this type of downtime. Idle times are not (cannot be) acquired directly from the machine as the device is unaware of such organizational events, the device just reports state ‘Down’. The data is taken from user input into the Operational Data Acquisition (ODA) program.

Equipment Idle Time Reasons Report

FIG 1:    Plant Manager Dashboard - Equipment Idle Time Analysis Report (click to enlarge)

Privacy notice

This website uses cookies. By continuing to use it you agree to our privacy policy. 

https://www.inventcom.net/oracle-manufacturing-operations-center/dashboards/equipment-idle-time-reasons

Oracle Manufacturing Operations Center | Dashboards | Overview

Oracle’s Manufacturing Operations Center (MOC) uses the concept of providing web- and role-based dashboards for different employees to gain the insights they need too. The... [read more]
Oracle Manufacturing Operations Center | Dashboards | Overview

Oracle Manufacturing Operations Center | Dashboards | Production Supervisor

This dashboard acts like an electronic whiteboard that automatically fetches data from your shop floor devices and provides real-time information about equipment status and... [read more]
Oracle Manufacturing Operations Center | Dashboards | Production Supervisor

Oracle Manufacturing Operations Center | Dashboards | Overall Equipment Effectiveness OEE

The standard of Oracle’s Manufacturing Operations Center (MOC) ships with a dashboard called ‘Plant Manager’ which includes several reports that output Overall... [read more]
Oracle Manufacturing Operations Center | Dashboards | Overall Equipment Effectiveness OEE

Oracle Manufacturing Operations Center | Dashboards | Production Loss Analysis

This dashboard outputs information about production loss distribution (B), effective production capacity (C) and production loss (D) for machines in a department of a plant... [read more]
Oracle Manufacturing Operations Center | Dashboards | Production Loss Analysis

Oracle Manufacturing Operations Center | Dashboards | Equipment Downtime Analysis

This dashboard shows downtime reasons machines in one or all departments of a plant within a selected period (A). The pie chart (B) below the selection area outputs the... [read more]
Oracle Manufacturing Operations Center | Dashboards | Equipment Downtime Analysis

Oracle Manufacturing Operations Center | Dashboards | Production Slippage Trend

This dashboard, accessible from the equipment downtime analysis report outputs, in addition to total production value (A), production slippage hours (B) and a performance to... [read more]
Oracle Manufacturing Operations Center | Dashboards | Production Slippage Trend

Oracle Manufacturing Operations Center | Dashboards | Equipment Efficiency Analysis

For selected equipment in one or all departments of a plant (A) this dashboard outputs an analysis about the efficiency of the manufacturing resources within a period of time. In... [read more]
Oracle Manufacturing Operations Center | Dashboards | Equipment Efficiency Analysis

Oracle Manufacturing Operations Center | Dashboards | Equipment Scrap Analysis

This dashboard shows an analysis about bad quality produced by manufacturing equipment in one or all departments of a plant (A) within a selected period. Right to a pie chart (B)... [read more]
Oracle Manufacturing Operations Center | Dashboards | Equipment Scrap Analysis

Oracle Manufacturing Operations Center | Dashboards | Batch Performance

This dashboard provides analytics tools for work orders executed within a selected period in all or single plants and product categories (A). The graph (B) on the left side below... [read more]
Oracle Manufacturing Operations Center | Dashboards | Batch Performance

Oracle Manufacturing Operations Center | Dashboards | Production Performance

This dashboard enables comparison of scheduled with actual equipment usage. Output can be limited to one or all departments in a plant within a selected period (A). The... [read more]
Oracle Manufacturing Operations Center | Dashboards | Production Performance
Modified: 2016-09-20